New software tools have been developed for Irus, the building energy management system.
Irus currently has more than 75,000 control units across 150 sites on its portal. Heat sources in bedrooms, kitchens and communal areas; hot water cylinders; leak detection equipment; and the kitchen safety devices are all individually controlled and feed data to the portal.
Recent analysis of annual energy consumption at two sites reveals heating load halved during winter months with Irus in control. Equally impressive is the 28% saved during the summer.
The system doesn’t restrict heating to room occupants - additional heat can be called for at any time. The system maintains comfortable environments but ensures energy isn’t used unnecessarily, for example when rooms are empty, windows are open, or the occupant leaves the room shortly after pressing the boost feature.
Optimiser and Investigator, the two new tools, add to existing control methods and savings by making visible the ‘difficult to identify’ unnecessary use of utilities.
Irus collects data from each control unit, including levels of humidity, light, occupancy, and (as an option) CO2. It also measures sound pressure, and of course temperature.
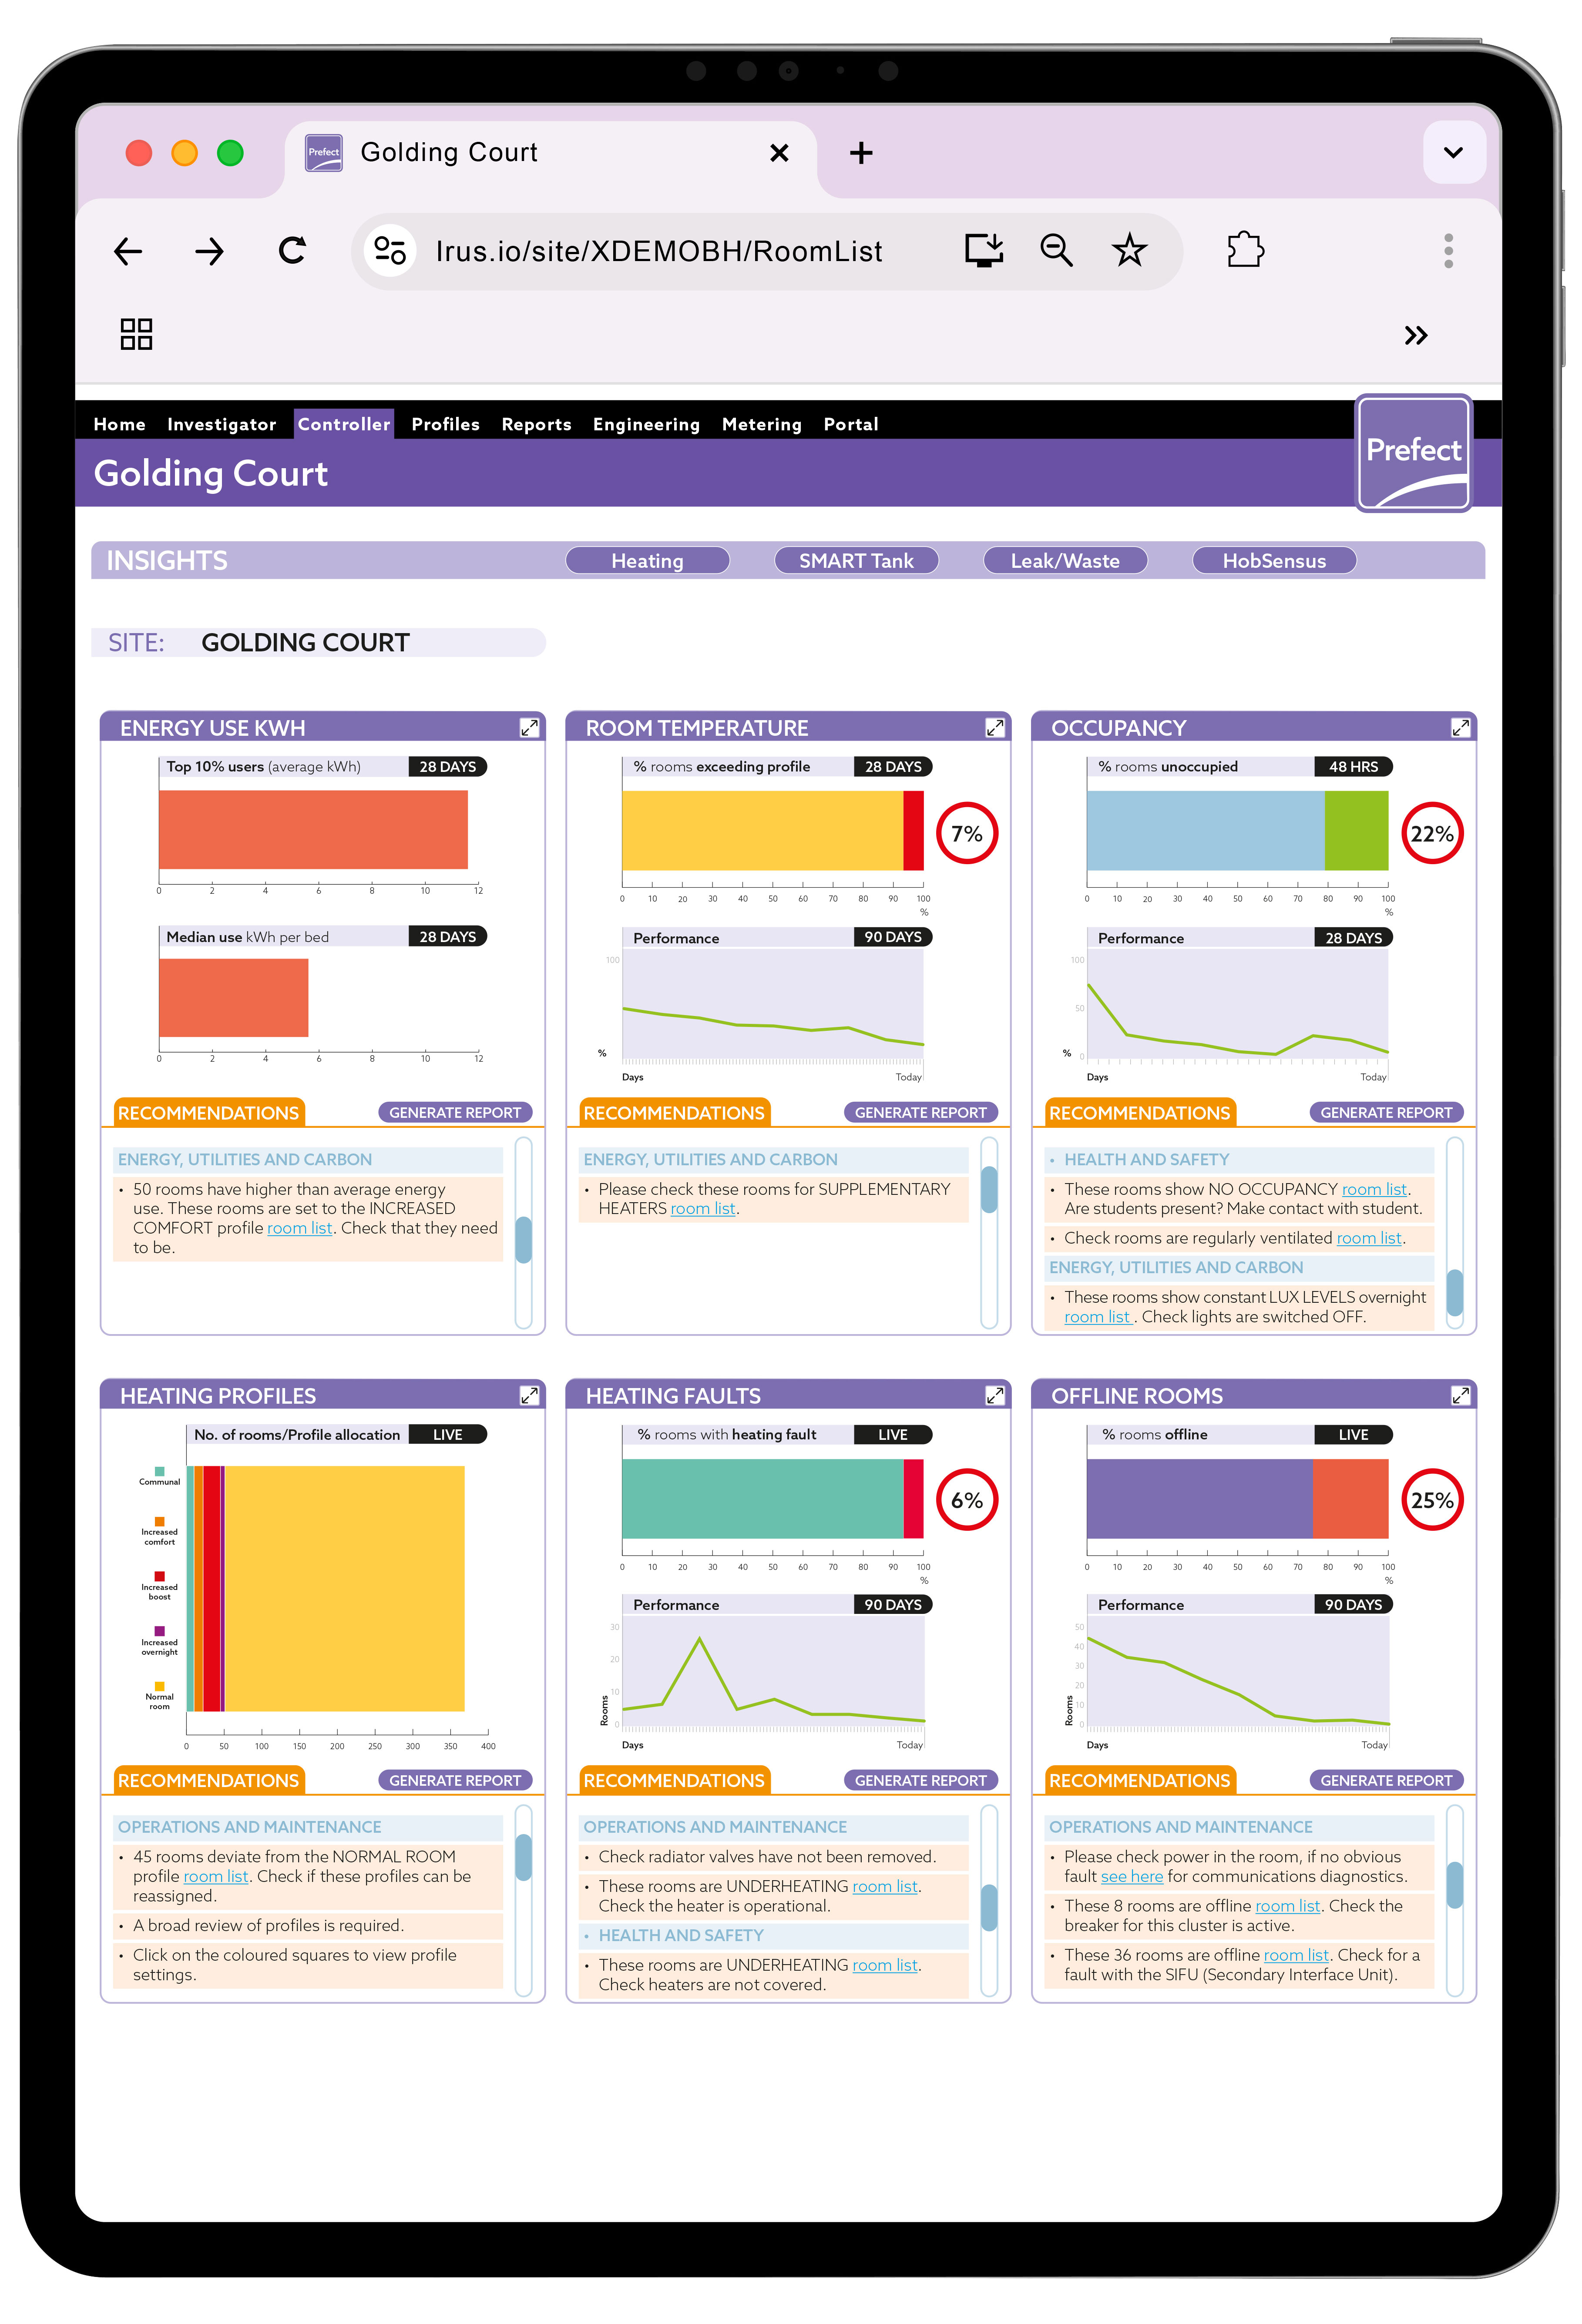
Optimising performance
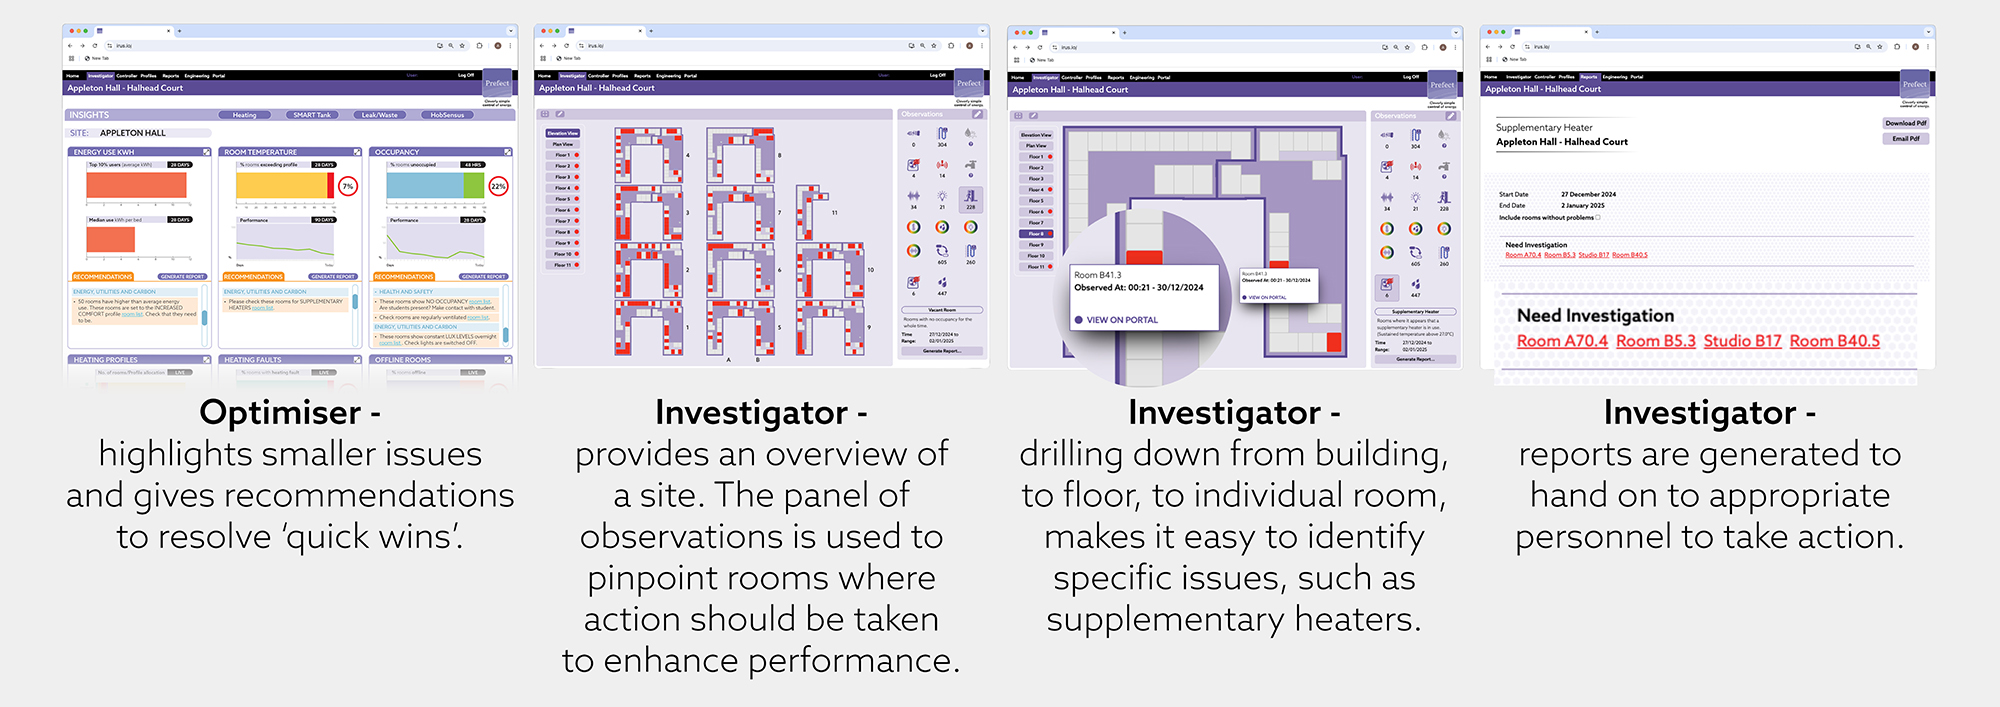
By analysing and interpreting this data Irus Optimiser delivers a prioritised list of the most pressing issues. ‘Quick wins’ are identified, and recommendations given to resolve problems such as:
A regular prompt, to address small things that cumulatively make a big difference, dramatically improves the efficiency and performance of the building, and adds to the already proven savings.
Deeper investigation of a building
For managers wanting greater scrutiny of their building and how it’s being used, Irus Investigator highlights potential issues.
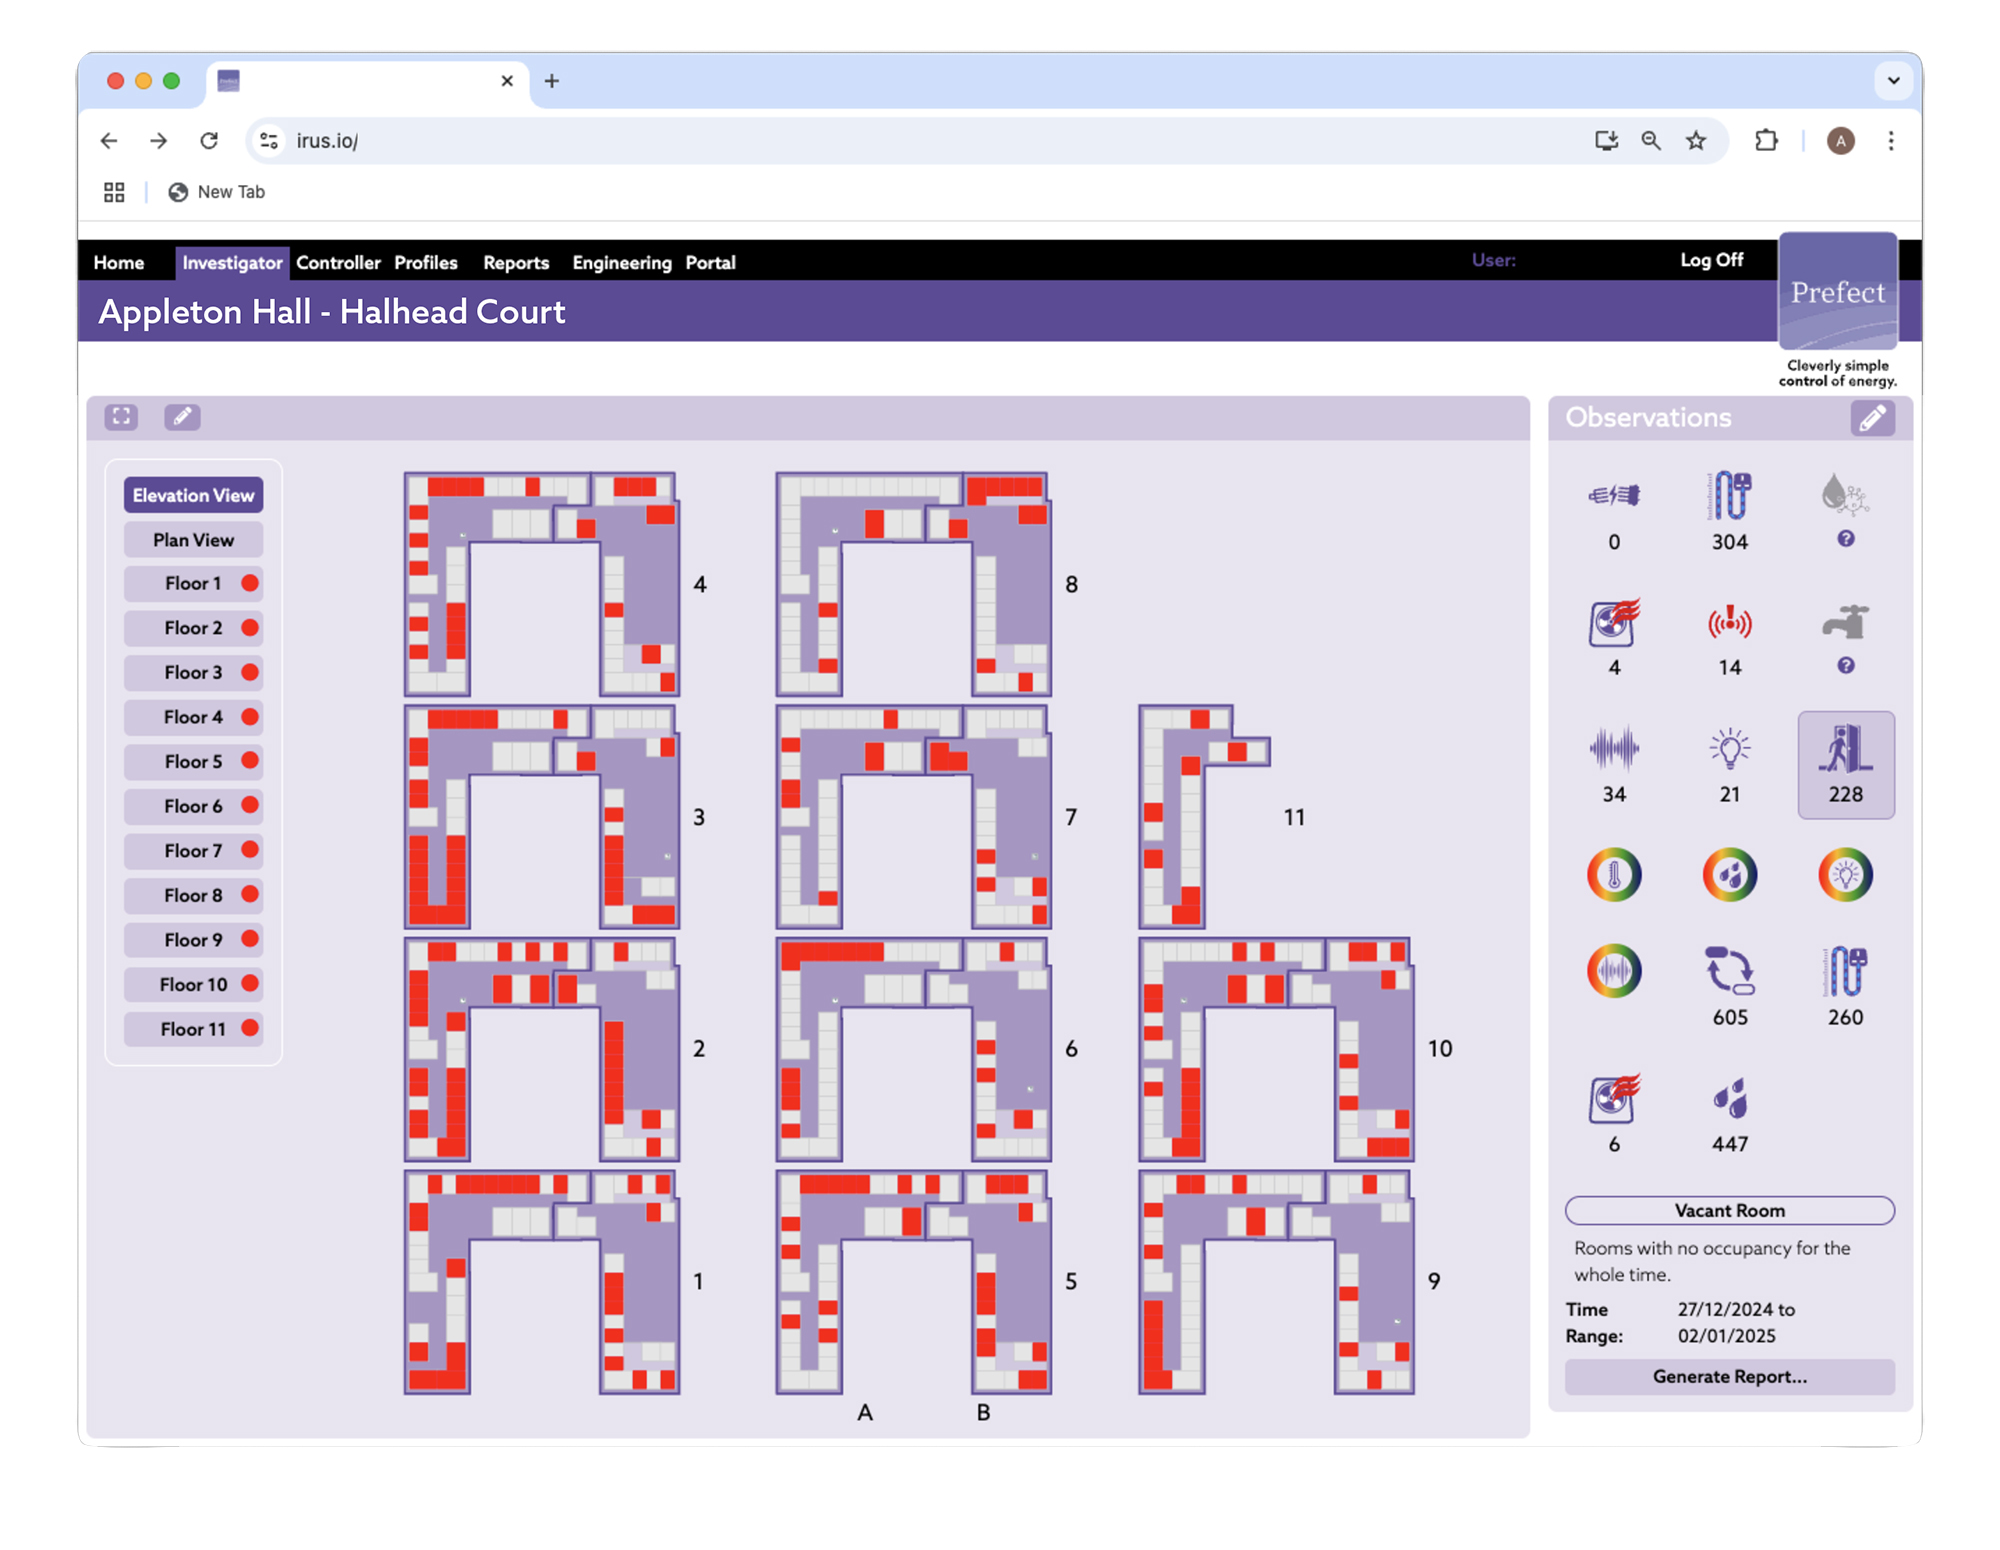
A panel can be customised to display the most pertinent ‘Observations’ for a particular site. Among many others these include:
Users can select a specific timeframe or view live data as it is collected.
A diagram of the building displays individual floors. When an ‘Observation’ is highlighted, the map locates the specific rooms where attention should be focussed. Clicking on the highlight identifies the exact location and from here the user can access the portal control page for that room.
Further investigation of historic data will determine if the conditions are a one-off or there is unusual behaviour at play. For example, rooms displaying higher temperatures than the heating system is supplying, indicates that supplementary heaters are being used. A report can be generated and supplied to front of house personnel, for them to take appropriate action.
The colour-map feature provides a visual comparison across an entire floor. Outliers within an area will determine whether a high humidity issue, for example, is affecting many rooms or is confined to a single room. This helps maintenance teams to pinpoint, and act upon the information in the most appropriate and efficient way.
To help manage planned maintenance, accommodation managers use the ‘Occupancy Pattern Observation’ tool to identify all the rooms that have been vacant for the date criteria they have entered
The ability to drill down, from site - to building - to individual room level - affords visibility and intelligence never available before with a building energy management system. Ensuring buildings are performing to their maximum capability.